

What if the “safest” neighborhood in Redondo Beach isn’t the best fit for your household? Search results may point to South Redondo, but rankings can use different boundaries, time periods, and methods. A citywide label also can’t tell you what a particular block feels like after dark or how it fits your commute. Choosing among the safest neighborhoods in Redondo Beach takes more than a single grade or crime score.
It’s reasonable to want a clear answer before choosing a home. Crime data can be difficult to compare across small areas, and activity in commercial districts may affect neighborhood-level figures. A ranking is a starting point, not a guarantee about a specific address.
This guide explains how to read safety information responsibly, compare North and South Redondo against your household’s priorities, and follow a practical routine for researching an address. You’ll learn what to look for in local data, how to add block-level context, and how to connect neighborhood research with your home search.
Key Takeaways
- Learn what neighborhood safety measures can show, and how factors such as lighting, traffic, and property conditions add practical context.
- Compare the safest neighborhoods in Redondo Beach using consistent geographic boundaries, reporting periods, and data sources.
- Use a repeatable checklist to review an address, visit at different times, and note observations that matter to your household.
- Rank priorities such as commute, daily routes, and housing type to compare candidate homes on more than a neighborhood label.
What “safest neighborhoods in Redondo Beach” can, and cannot, tell you
Neighborhood safety is not a single score. It includes measurable factors, such as reported crime, and practical conditions that shape daily routines, including street lighting, traffic exposure, visibility, and the condition of nearby properties. A crime summary can help you understand reported incidents within a defined area and period. It can’t tell you exactly how safe a particular person will feel walking home or predict what will happen at a specific address.
Safety rankings are comparison tools, not predictions about an individual block, home, or household. Use them to frame questions, then combine them with local observations and your own priorities.
Why a neighborhood-wide label cannot describe every block
Boundaries matter. A data provider’s “neighborhood” may be a mapped area that differs from a city district, postal address, or familiar local name. Comparisons can change when boundaries change, even if the underlying incidents do not. Before relying on a ranking, look for its geographic unit, reporting period, and method. Avoid declaring one area the safest unless a dated source compares clearly defined areas using consistent data.
Counts and rates answer different questions. An incident count is the number of reported events in an area during a stated period. A rate adjusts that count to a population or another denominator, making comparisons between differently sized populations more meaningful. It still depends on the chosen boundary and measure. Neither figure describes lighting, traffic conditions, or how a street feels at the times you use it.
Citywide and neighborhood summaries can conceal differences between nearby blocks. A busy commercial corridor and a quiet residential street may contribute to the same area-level figure while serving very different daily needs. Treat the summary as context, not a substitute for looking closely at a specific location.
Which local place names need careful boundary checks?
North Redondo and South Redondo are broad local labels, not necessarily standardized crime-data units. The Redondo Beach Wikipedia page offers general geographic context, but use current city maps and the data provider’s own boundaries when evaluating an address.
Apply the same care to Riviera Village and Hollywood Riviera. A familiar name may refer to a commercial district, a broader community, or an area that does not match municipal or mapping boundaries. Don’t assume a listing’s neighborhood label matches a safety map. Confirm the property’s location and jurisdiction, then compare only areas defined consistently. This helps you assess the home itself rather than relying on a label that may cover a different area than you expect.
How to compare Redondo Beach safety data without misreading rankings
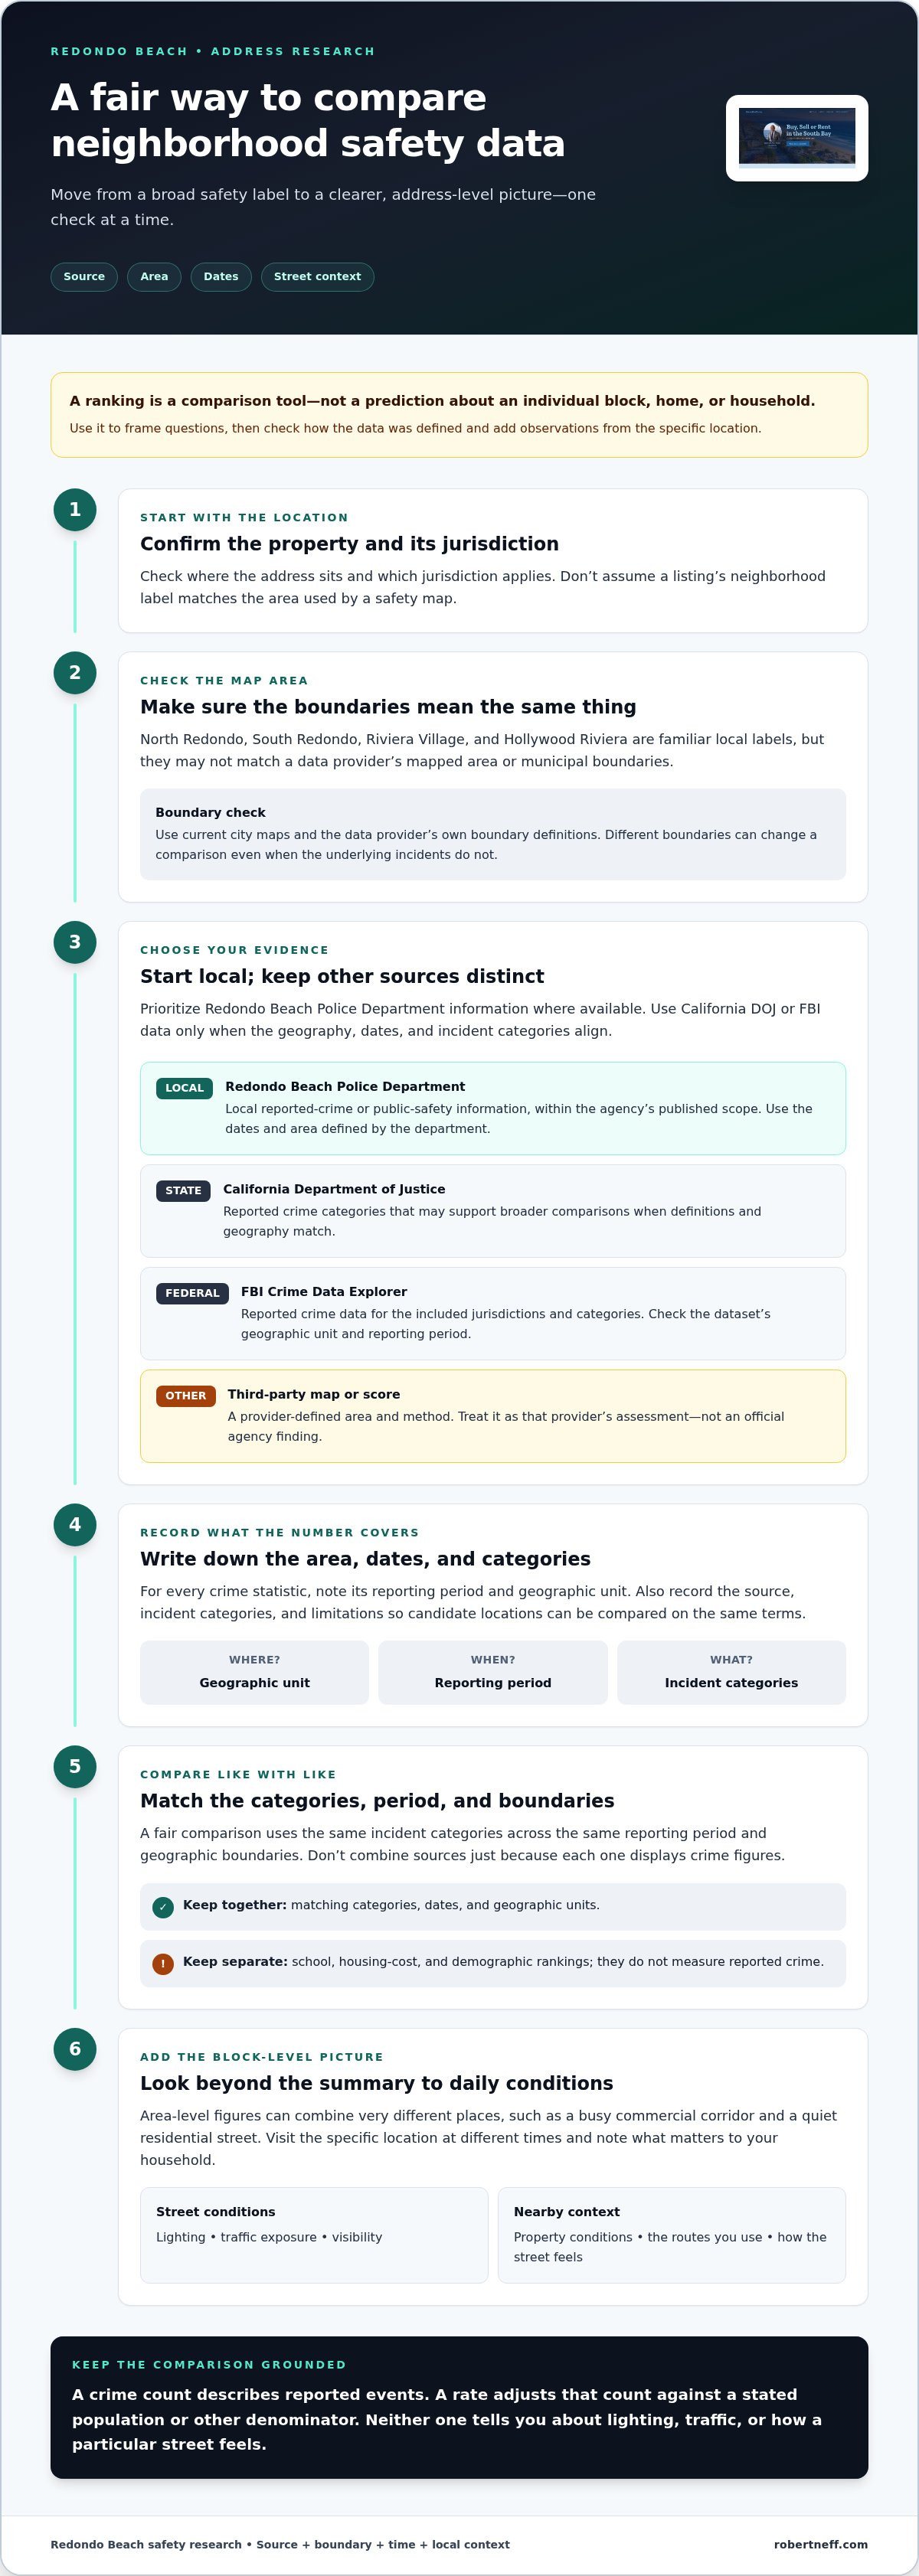
A useful comparison starts with the source’s definitions, not its grade or map colors. Prioritize current Redondo Beach Police Department information where available, then use California Department of Justice or FBI Crime Data Explorer data only when the geographic units, dates, and incident categories align. A third-party score can offer another perspective, but keep it distinct from official agency data and check how it was calculated.
For every crime statistic, state its reporting period and geographic unit. Without both, readers can’t tell what the number represents or compare it responsibly.
| Source | Geographic unit | Reporting period | What it can show |
|---|---|---|---|
| Redondo Beach Police Department | As defined in the agency’s information or data | Use the dates shown by the department | Local reported-crime or public-safety information, within the agency’s published scope |
| California DOJ | As specified in the dataset | Use the available year or date range | Reported crime categories that may support broader comparisons when definitions and geography match |
| FBI Crime Data Explorer | As specified in the dataset | Use the displayed reporting period | Reported crime data for the included jurisdictions and categories |
| Third-party map or score | Provider-defined map area | Provider-defined; check the displayed dates | A modeled score or visual comparison, not an official agency finding |
Which official sources can help assess reported crime?
Start with Redondo Beach Police Department resources for local public-safety information, and note when the information was published or updated. California DOJ and the FBI can add context, but their datasets may use different reporting systems, categories, or geographic coverage. Don’t combine them simply because both display crime figures. Label a third-party map grade as that provider’s assessment, not as a police department or government rating.
What makes two neighborhood safety comparisons fair?
Compare the same incident categories across the same period and geographic boundaries. Counts show how many incidents were recorded; rates adjust counts against a stated population or denominator. Map colors summarize a provider’s chosen scale, so a darker or lighter shade isn’t proof of a particular street’s conditions. Keep school, housing-cost, and demographic rankings separate. They may inform a home search, but they don’t measure reported crime.
For a home search, keep a simple comparison record: source, unit, dates, categories, and limitations. This makes it easier to evaluate candidate locations against the same evidence and your household’s priorities. If you’re weighing neighborhoods alongside property options, buyer search and negotiation guidance can help connect that research to a focused home search.
North Redondo, South Redondo, and nearby areas: compare priorities, not labels
North Redondo and South Redondo are useful starting points for a home search, but broad labels don’t establish how a specific block compares for safety. General descriptions distinguish inland North Redondo from coastal South Redondo, but those characteristics aren’t a substitute for current, consistently defined local crime data. Before comparing areas, confirm how each source draws its boundaries and whether its data covers the same period and incident categories.
Use the table to frame your research. Treat housing and routine details as questions to investigate at the property level, not as evidence that one area is safer.
| Area or label | Data coverage | Housing context | Daily routines to consider | Questions to investigate |
|---|---|---|---|---|
| North Redondo | Confirm whether the source maps this area separately and which boundaries it uses. | Compare the housing types available around each candidate address. | Test your actual commute, walking routes, and access to everyday destinations. | Does the data cover the specific blocks you’re considering? |
| South Redondo | Check that the comparison uses the same source, period, and incident categories as North Redondo. | Compare the home types and surroundings of individual properties. | Consider how coastal location and your regular destinations shape travel and activity. | Are area-wide results being applied to a much smaller location? |
| Riviera Village | Use a separate result only if the source defines this precise area. | Assess the property and its immediate surroundings rather than assuming one housing pattern. | Observe nearby activity and routes at the times you expect to use them. | Does the map distinguish the named area from adjacent streets? |
| Hollywood Riviera | Confirm the mapped area and municipal jurisdiction before assigning crime data. | Evaluate each home’s setting and property context individually. | Check the routes and destinations that would form part of your routine. | Does the source’s boundary match the place name used in the listing? |
What should buyers compare between North and South Redondo?
Start with your routine. Map the commute, school or work trips, errands, and walks you expect to make, then consider how each candidate address fits. Visit the surrounding streets and compare relevant observations, such as lighting, visibility, traffic, and activity. Keep the same safety-data source and definitions for both areas; don’t treat a broad neighborhood label as a block-level assessment.
How should you assess Riviera Village and Hollywood Riviera?
Place names can refer to areas that don’t align neatly with a city boundary or a data provider’s map. Confirm jurisdiction and mapped limits before attaching a crime statistic to either name. Local businesses and activity may help describe what a visit feels like, but they aren’t crime evidence. If a source doesn’t provide comparable data for the named area, state that gap plainly rather than ranking it.
A practical Redondo Beach safety checklist for evaluating a specific home
Once you’ve narrowed your search, apply the same process to each address. A repeatable checklist helps you compare observations without treating a neighborhood label or a single visit as a complete answer.
- Review current crime information. Start with available Redondo Beach Police Department data. Record the source, reporting period, geographic unit, and incident categories so you know what the information covers.
- Map the boundaries. Confirm the property’s location and jurisdiction, then check whether the data area actually includes the address. Note any mismatch between a familiar neighborhood name and the map boundary.
- Visit at different times. Check the block during times that reflect your expected routine, such as a commute or evening walk. A visit is a snapshot, not a prediction.
- Observe the block and routes. Look at lighting, sightlines, sidewalks, crossings, traffic, and activity along the paths you would use regularly. Consider the walk from parking or transit to the home, not just the front entrance.
- Record questions and follow-up items. Note specific observations tied to the address, then separate questions about reported crime from property condition, traffic, and local hazards.
Observations across different times and routes provide more useful context than one visit alone. Keep notes for each candidate home. That makes differences easier to compare and helps distinguish a specific concern, such as a poorly lit crossing, from a general impression about an entire area.
What should you observe on the block and nearby routes?
Walk the routes that would matter in your household’s daily life. Notice whether streetlights illuminate sidewalks and crossings, whether parked vehicles or landscaping limit sightlines, and how traffic affects access on foot. Look at the immediate surroundings as well as the route to everyday destinations. Record what you saw, where you saw it, and when. Don’t treat a quiet or busy moment as a settled pattern.
What should you verify beyond crime data?
Crime information is only one part of home due diligence. Review the property’s condition separately, and consult current public-agency resources for relevant coastal hazards, emergency information, and evacuation guidance. These address different questions from reported crime. A favorable crime comparison does not establish that a property is in good condition or outside a hazard area. Verify local guidance before relying on it, and keep each finding distinct in your notes.
For the safest neighborhoods in Redondo Beach, the most useful comparison connects published information with the address, routes, and priorities that matter to you. Discuss your Redondo Beach home search with Robert Neff to connect neighborhood research with your property priorities.
Turn Redondo Beach safety research into a confident home search
Safety research becomes more useful when it’s part of a consistent home-search plan. First, decide which factors matter most to your household. You might rank commute and daily routes alongside housing type, nearby activity, property condition, and the quality of available local safety data. Separate firm requirements from preferences. That distinction can help you weigh trade-offs without letting one ranking make the decision for you.
How can you build a fair shortlist of Redondo Beach homes?
Choose the same criteria for every candidate location before comparing listings. For each address, use the same safety sources and checklist, and record:
- Location: the mapped boundary and jurisdiction used for the comparison.
- Evidence: source, reporting period, incident categories, and any gaps in coverage.
- Daily fit: commute, regular routes, and how the home’s location supports your routine.
- Property fit: housing type, condition, and other features that matter to your household.
- Open questions: observations or details that need further review.
Keep these notes together in one comparison sheet. This makes it easier to distinguish documented information from your own observations and compare homes on equal terms. Revisit your priorities as you learn more about the available properties. A location that initially seems ideal may involve a commute or property trade-off that changes how well it fits. For additional context on balancing location and property features, see this South Bay coastal homes buyer reference.
How can buyer representation support neighborhood research?
Buyer representation can help organize the search around your stated priorities. Robert Neff’s buyer search and negotiation guidance, supported by professional market analysis, helps you compare candidate homes against the factors you’ve identified without treating a neighborhood label as a safety guarantee. He also guides first-time and relocating buyers through the search. For more on the role of a buyer’s representative, read about strategic buyer representation in the South Bay.
The goal isn’t to find a label that promises certainty. It’s to make a considered choice using comparable information, address-level observations, and your household’s needs. If you’re planning a South Bay home search, discuss your priorities with Robert and shape a focused plan for comparing locations and properties.
Make your Redondo Beach home search a considered one
The safest neighborhoods in Redondo Beach aren’t identified by a label alone. A useful comparison checks current crime information alongside its reporting period and boundaries, then adds what you observe on the block and along your daily routes. Applying the same checklist to each home helps you compare locations fairly and keep crime data distinct from property condition and coastal or emergency considerations.
Your priorities matter, too. Commute, housing type, routine, and the evidence available for a specific address can all shape which home feels like the right fit. Robert Neff, a licensed California Realtor® (DRE #02442812), offers buyer search and negotiation services, including guidance for first-time and relocating buyers. His role is to connect your stated priorities with location and property comparisons, not to promise a particular safety outcome.
Ready to put your research into a focused South Bay home search? Discuss your South Bay home search with Robert Neff. Robert can help you compare coastal homes across Redondo Beach, Hermosa Beach, Manhattan Beach, El Segundo, Palos Verdes, and Torrance using the priorities that matter to you.
Frequently Asked Questions
Is Redondo Beach a safe place to live?
There isn’t a reliable blanket yes-or-no answer because safety can vary by block, time, and the measure being considered. Review current local crime information, noting its source, reporting period, and geographic coverage, then visit the specific area. Also consider questions crime data doesn’t answer, such as traffic exposure, lighting, property condition, and your household’s comfort on everyday routes.
What are the safest neighborhoods in Redondo Beach?
No definitive ranking is useful unless its sources, dates, boundaries, and measures are clear and comparable. Third-party maps and citywide summaries may use different methods, so treat them as starting points rather than proof that one neighborhood is safest. Compare North Redondo, South Redondo, and other precisely defined areas using consistent data, then investigate the streets around homes you’re considering. Any ranking or statistic should include its date and geographic unit.
Is North Redondo safer than South Redondo?
You can’t establish that reliably from broad neighborhood labels alone. A fair comparison requires the same data source, reporting period, geographic scale, and incident definitions for both areas. Review current local evidence, then consider how each candidate block fits your household’s routines and visit the locations you’re weighing. Unless comparable, verifiable data supports a difference, don’t infer that North Redondo or South Redondo is safer.
How can I check crime in a Redondo Beach neighborhood?
Start with current Redondo Beach Police Department information, and see whether California Department of Justice or FBI data provides comparable local detail. For each source, record the publication date, reporting period, geographic unit, and incident categories. Third-party map scores may add context, but they aren’t official findings. Check the map’s boundaries against the location you’re assessing, since a provider’s mapped area may not match a familiar neighborhood label.
Is Hollywood Riviera part of Redondo Beach?
Don’t assume a place name and municipal boundary match. Before applying Redondo Beach crime data to Hollywood Riviera, verify the specific address and the boundaries used by the public agency or map provider. A neighborhood-wide statistic applies only if the source actually covers that location and uses a comparable geographic unit. If the boundaries don’t align, note the limitation rather than treating the figure as address-specific evidence.
Can a crime map tell me whether a specific Redondo Beach home is safe?
No. A crime map can help show patterns in reported incidents, but it can’t guarantee what will happen at a specific property. Its value depends on the source, date range, location accuracy, and reporting practices. Use it as one part of your research: visit the block, observe nearby routes, review property condition, and consult current public-agency information relevant to the address.
What should I look for when visiting a Redondo Beach neighborhood?
Visit at different times and observe lighting, visibility, sidewalks, crossings, traffic, and the routes your household expects to use. Record specific details and questions instead of relying on one impression. Keep reported crime separate from coastal hazards, property condition, and emergency information, since each requires different research. If you’re comparing a broader South Bay search, apply the same process to homes in Hermosa Beach, Manhattan Beach, El Segundo, Palos Verdes, or Torrance.


