

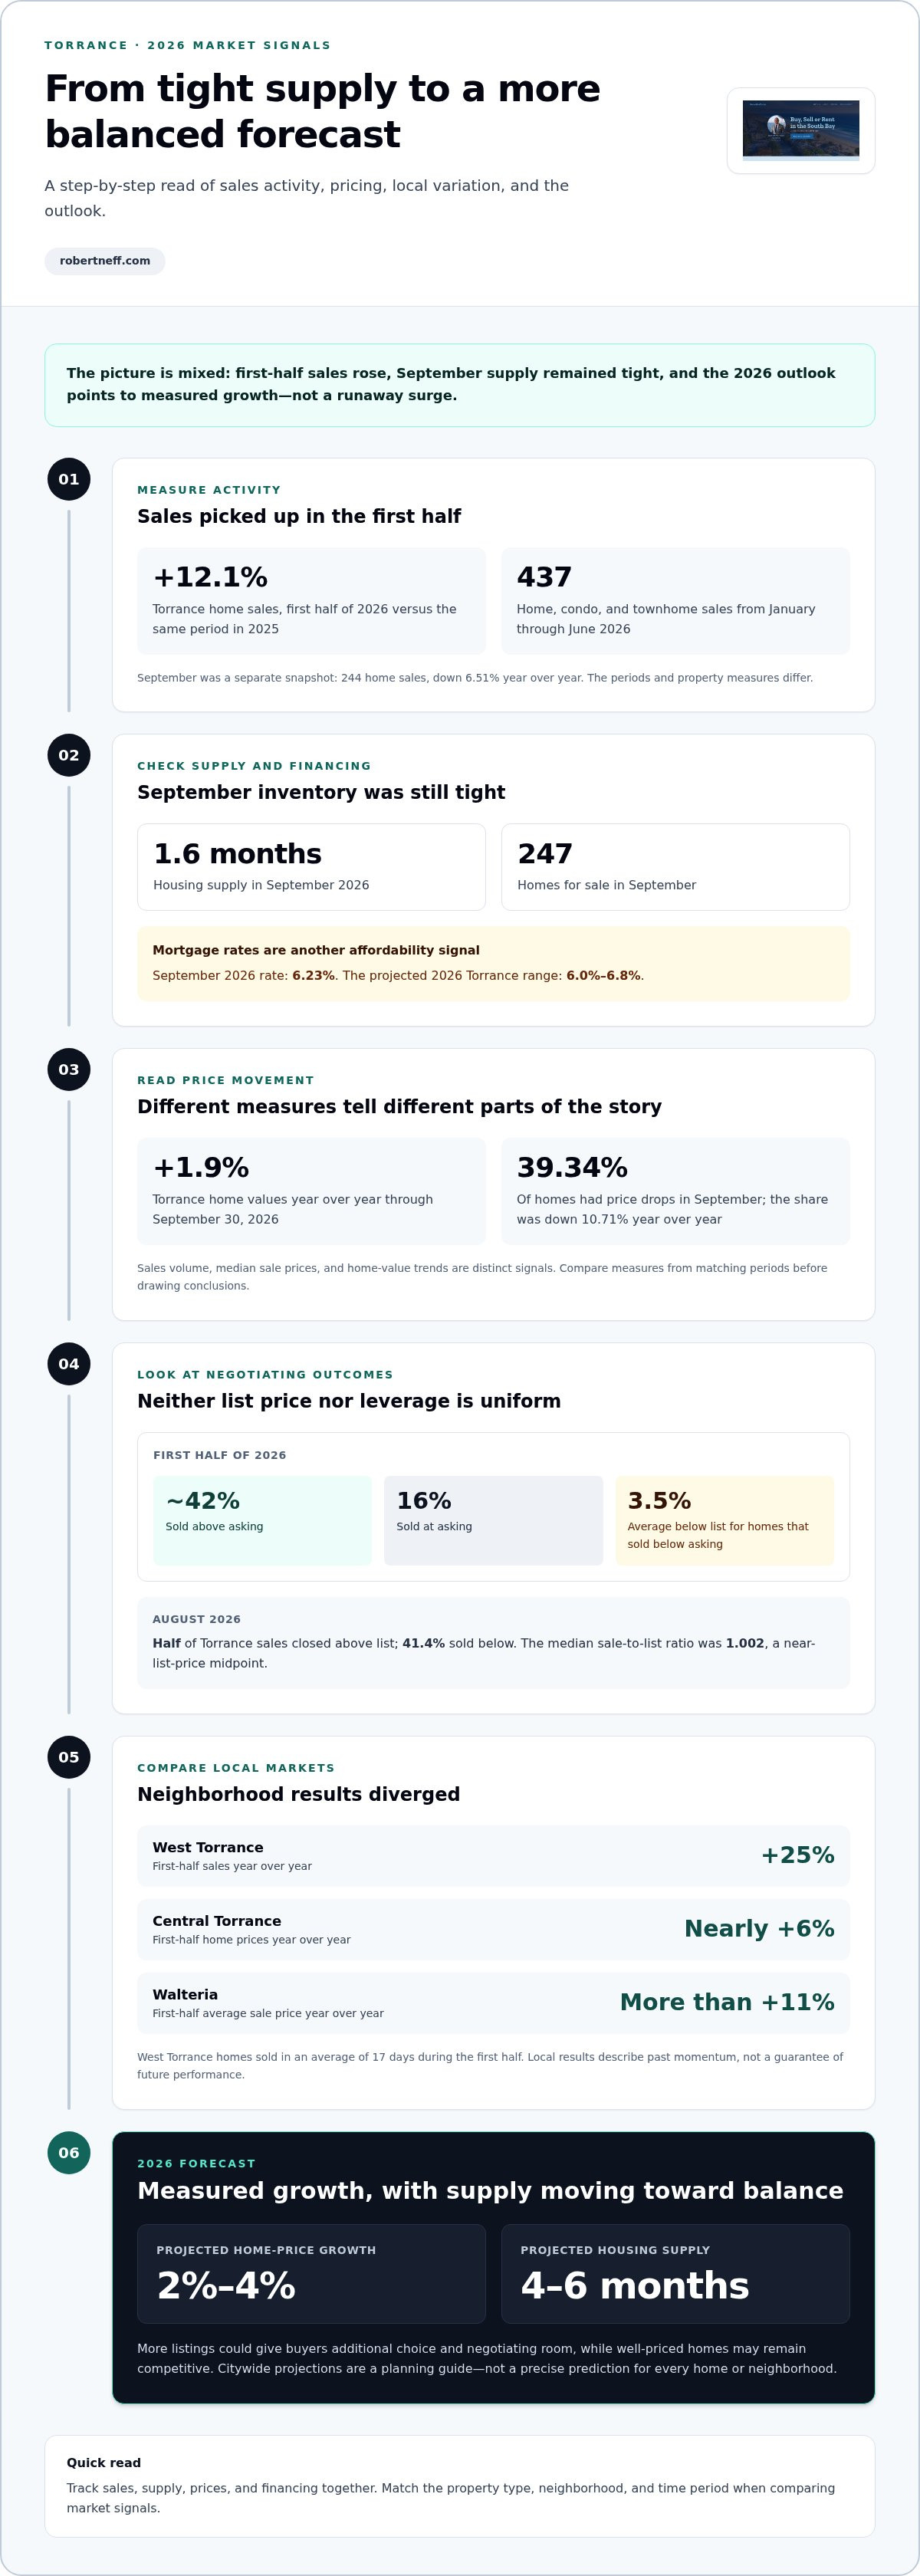
Torrance home sales rose 12.1% in the first half of 2026 compared with the same period in 2025, even as the outlook points to measured price growth rather than a runaway surge. The Torrance CA real estate market forecast for 2026 projects home prices rising by 2% to 4%, with housing supply moving toward 4 to 6 months. Buyers and sellers may find a more balanced market ahead, though conditions still vary by property and neighborhood.
It makes sense to wonder who has the upper hand: recent competition has favored sellers in some parts of Torrance, while more listings could give buyers additional room to compare homes and negotiate. A citywide forecast is a useful starting point, not a guarantee that every home will follow the same pattern.
This article examines prices, sales activity, inventory, and the risk of a housing crash, then explains what those signals may mean for your next move. It also shows how to read broader trends alongside differences between detached homes, condos, and neighborhoods.
Key Takeaways
- Compare sale prices with days on market to understand how pricing and buyer pace can differ across Torrance homes.
- Above- and below-asking sales both occur, so list price alone won’t tell you how much negotiating room a property may have.
- Read sales volume alongside year-over-year price changes to distinguish a shift in activity from a broad market downturn.
- Use the 2026 outlook as a planning guide, then weigh local inventory and property type when shaping your next move.
What's the average home price in Torrance?
Torrance’s average home value was $1,100,115 on September 30, 2026. These figures measure different things and dates, so use them as separate market signals, not interchangeable prices.
For comparison, Los Angeles County’s median home value was $871,674. Torrance’s average value is higher, but comparing an average with a median is not an exact like-for-like measure. Nearby-city comparisons are most useful when they match property type and time period; citywide figures can conceal neighborhood-level differences.
Sales pace also depends on the measure and period. Torrance homes averaged 29 days on market in the first half of 2026. In September, the median time to pending was 16 days, while median days on market was 48. Those measures differ, and pending time is not the same as total market time.
List-price results show mixed conditions. In August, half of Torrance sales closed above list price, while 41.4% sold below. The median sale-to-list ratio was 1.002, indicating a near-list-price midpoint across sales. Individual results can still vary with property condition, pricing, and buyer demand.
Property type and neighborhood shift the averages. West Torrance sales rose 25% year over year in the first half, and homes sold in an average of 17 days. Compare similar homes before interpreting a citywide price as a guide for one property.
Will the Torrance Housing Market Crash in 2026?
September inventory points to a tight market, not a surge of unsold homes. Torrance had 1.6 months of housing supply and 247 homes for sale. Limited supply can support prices, although it doesn’t guarantee every listing will attract competing offers. For a crash assessment, track inventory alongside sale prices and buyer activity.
First-half sales show both competition and room to negotiate. Approximately 42% of Torrance homes sold above asking price, while 16% sold at asking. Homes that closed below asking sold for an average of 3.5% under list. This mix suggests outcomes depended on each property’s pricing and appeal, rather than every seller having equal leverage. A citywide average cannot predict one home’s final offer.
Rental conditions offer another signal, but recent rent growth does not guarantee a rental return. Yield depends on rent relative to the purchase price and ongoing ownership expenses, so the same rent can produce different yields for different properties.
Several factors could change the outlook. The September 2026 mortgage rate was 6.23%, and the projected 2026 Torrance range was 6.0% to 6.8%. Rate changes affect buyers’ borrowing costs and purchasing power. Inventory, sale prices, and financing conditions therefore deserve close attention together. A rise in available homes alongside slower sales would shift negotiating power; constrained supply with steady demand would support competition.
For renters comparing coastal housing options, Coastal Rental Search can help focus the search. For a buyer or seller, the practical takeaway is to assess the specific home’s price, condition, and competing listings, rather than relying on crash headlines alone.
Torrance sales volume and year-over-year change
Torrance recorded 437 sales of homes, condos, and townhomes from January through June 2026. That count captures activity across three residential property types. September recorded 244 home sales, down 6.51% year over year. These snapshots cover different periods, so they aren’t direct comparisons. Together, they show why sales activity should be tracked by period and property mix.
By contrast, Torrance home values increased 1.9% year over year through September 30, 2026. These measures can move differently: the median sale price reflects homes sold, while home-value measures track value trends. A different mix of homes selling can shift the median without matching broader value movement.
Neighborhood figures add another layer. Central Torrance home prices increased nearly 6% year over year during the first half of 2026. That result contrasts with September’s citywide median-sale decline, but the periods and measures differ. For a Central Torrance comparison, match a property’s type and sale period before using neighborhood appreciation to set expectations. Citywide figures can conceal local changes.
Price reductions offer another demand signal. In September 2026, 39.34% of Torrance homes had price drops, down 10.71% year over year. A lower share of reductions may suggest closer alignment between initial pricing and buyer response. Still, compare that measure with completed sales and median prices from the same period before drawing conclusions about market direction.
For a practical read, compare sales volume, median sale price, and home-value movement together. Buyers can use slower monthly sales or price reductions as prompts to examine a listing’s competition and pricing. Sellers can weigh neighborhood results and recent comparable sales when setting expectations. In Torrance, the 437 first-half transactions and September’s softer monthly comparison show why one headline cannot describe every property segment.
Housing market forecast
The Torrance CA real estate market forecast 2026 points to measured growth, not a dramatic surge. Prices are projected to rise 2% to 4%, with supply reaching around 4 to 6 months. That may give buyers more choice while well-priced homes remain competitive. These citywide projections offer direction, not a precise prediction for every neighborhood or property.
Walteria had the strongest reported neighborhood price growth: its average sale price increased more than 11% in the first half of 2026 compared with the previous year. Central Torrance prices rose nearly 6% over that period. These results show recent momentum, not which neighborhood will lead through the rest of 2026. Compare current sales within each area before relying on past growth.
Mortgage rates will influence affordability and purchasing power. California’s average 30-year fixed mortgage rate is forecast at 6.0% in 2026, while the projected Torrance range is 6.0% to 6.8%. Higher borrowing costs can constrain buyers’ budgets; lower rates can expand purchasing power. A buyer’s price range depends on financing costs as well as the home’s price.
Existing single-family sales are forecast at 274,400 units in 2026, up 2% from the projected 2025 total. Active listings statewide are forecast to rise nearly 10%, potentially broadening buyer choice. Torrance prices will also reflect local inventory, property type, and neighborhood demand. Detached homes and condos may follow different paths, so compare similar properties and recent local sales.
Use the Torrance CA real estate market forecast 2026 as a planning reference, then weigh your target neighborhood, property type, and financing before setting a budget or list price. Discuss a Torrance home-buying or selling strategy grounded in local market conditions.
Robert Neff, Ph.D., Realtor®: Buyer Search & Negotiation Services
Robert Neff, Ph.D., Realtor® helps buyers weigh Torrance prices, inventory, and negotiating conditions through buyer search and negotiation services. This support can turn broad market signals into a focused search and a property-specific offer strategy. First-time buyers and people relocating can also get step-by-step guidance for their next move.
For homeowners preparing to sell, Robert Neff provides market analysis, strategic pricing, staging, and marketing to help position a property against current competition while highlighting its individual features. If you’re exploring rentals instead of buying, he also offers coastal rental search services.
Consider these services when you’re ready to move from studying the forecast to making a housing decision. Contact Robert Neff, Ph.D., Realtor® or visit robertneff.com to discuss your next step.
Turn the Forecast Into a Thoughtful Next Step
A market outlook is most valuable when it helps you make a decision that fits your plans. The Torrance CA real estate market forecast for 2026 can inform your timing, but your priorities, property type, and readiness to move should guide the final strategy. A buyer may need to refine a search and prepare to negotiate, while a seller may focus on positioning and marketing. Someone buying for the first time or relocating may benefit from step-by-step guidance.
Robert Neff, Ph.D., Realtor® offers Buyer Search & Negotiation Services, Residential Property Listing & Marketing, and Relocation & First-Time Buyer Guidance. The right starting point depends on whether you’re purchasing, preparing to sell, or planning a move. A clear conversation about your goals can turn broad market signals into a practical path forward.
Contact Robert Neff, Ph.D., Realtor® to discuss your Torrance real estate plans. With a considered strategy, you can move ahead with greater clarity and confidence.
Frequently Asked Questions
Are Buyers or Sellers Controlling the Torrance Market?
Neither side controls every Torrance transaction; leverage depends on the home and its competition. In September 2026, 43.85% of homes sold above list price, while the median sale-to-list ratio was 100.89%. Buyers can compare similar listings and examine price changes before making an offer. Sellers can use recent comparable sales to set a list price that reflects the property’s condition and neighborhood.
Is There Enough Inventory in Torrance Right Now?
Inventory gives Torrance buyers options, but it remains limited relative to demand. The city had 131 active homes for sale in September 2026, up 5.65% year over year. That increase offers more choice than the prior year, though selection depends on location, property type, and budget. Buyers can narrow their search criteria and compare newly listed homes with properties that have been available longer.
What is the 2026 home price forecast for Torrance, CA?
Torrance home prices are forecast to rise by 2% to 4% in 2026. That projection indicates moderate appreciation rather than a steep citywide increase. A specific home may perform differently because condition, location, property type, and competing listings influence buyer interest. Use the forecast as context for planning, then compare similar homes in the same Torrance neighborhood before deciding what to offer or how to price a listing.
What is the median home price in Torrance, CA in 2026?
This figure describes the midpoint of sales for that month, not a fixed price for every home or the full-year median. Sale prices vary by property type and neighborhood. For a useful comparison, look at homes with similar locations and features, and use the same sale month when reviewing price trends.
How are Torrance home prices expected to change year over year in 2026?
The 2026 forecast projects Torrance home prices to increase by 2% to 4%. That projection is forward-looking, while year-over-year figures report changes already measured over a past period. To apply the outlook, compare a home’s recent neighborhood sales with its property type and condition. A citywide growth estimate can guide planning, but it won’t indicate the exact value change for each home.
What is the 2026 forecast for Torrance home sales and inventory?
Torrance’s 2026 forecast projects housing supply at around 4 to 6 months. California existing single-family home sales are forecast at 274,400 units, a 2% increase from the projected 2025 total; active state listings are forecast to rise nearly 10%. These statewide projections provide context, not Torrance-specific sales totals. For local decisions, watch Torrance listings and closed sales alongside broader California trends.


